Intro
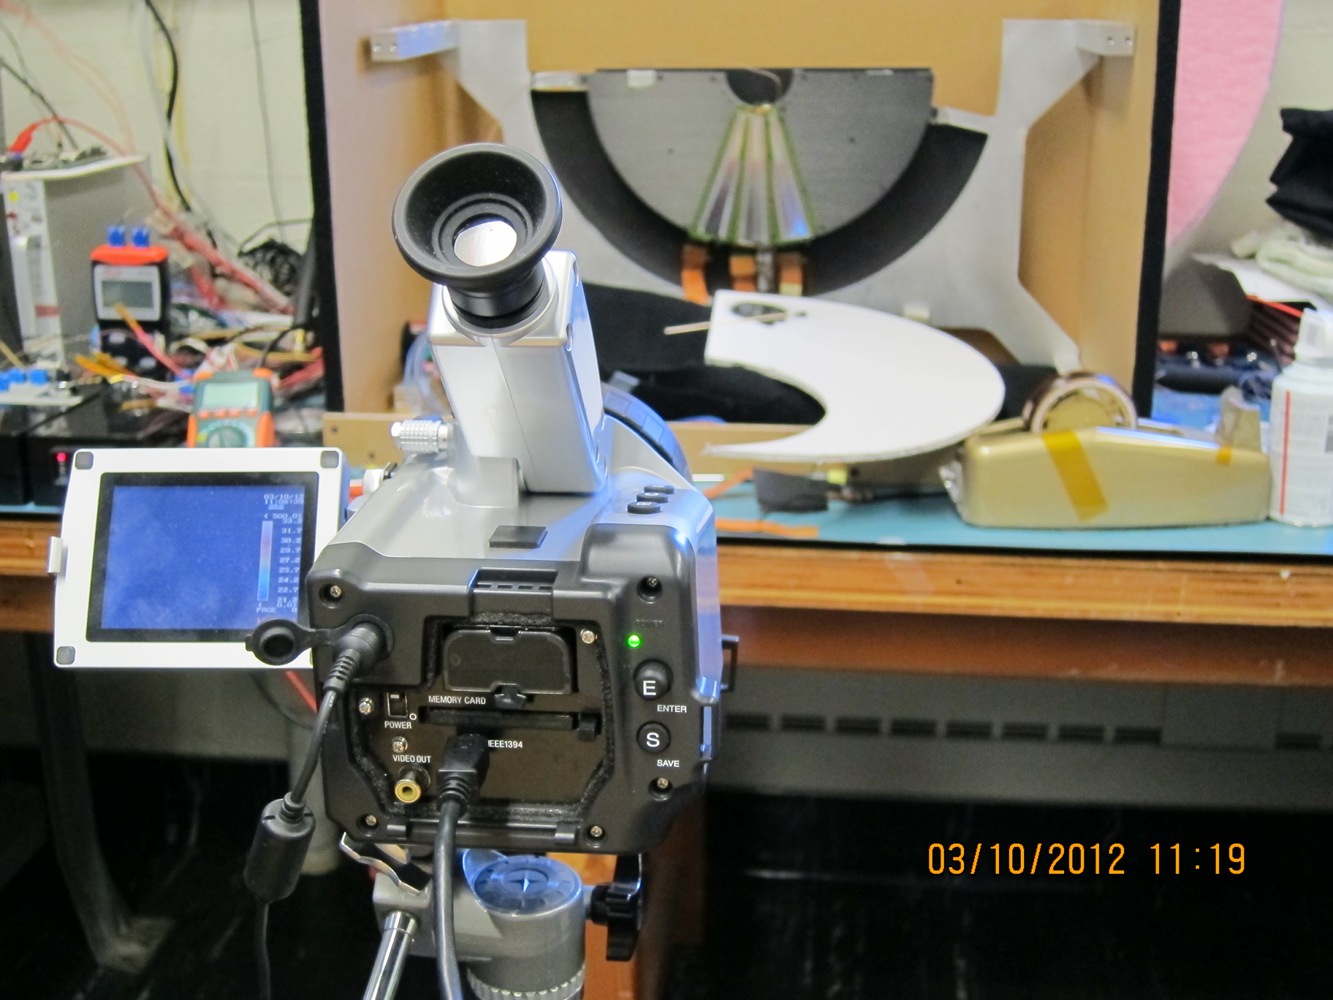
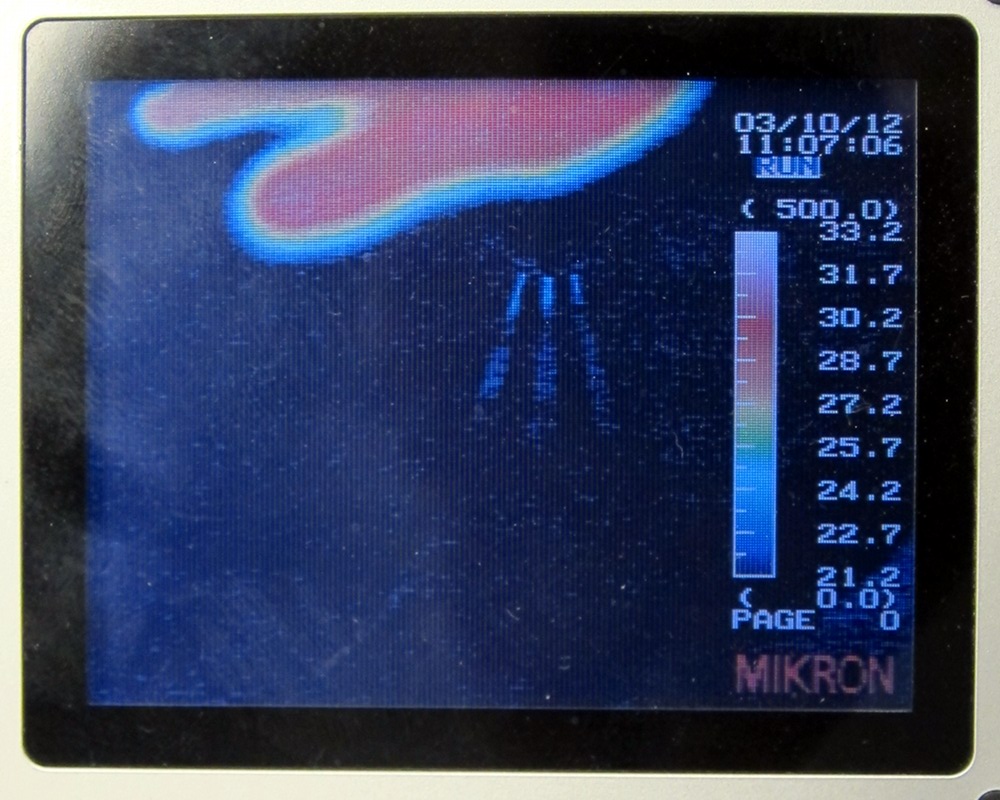
March 10, 2012: I borrowed a fancy thermal camera [Mikron 7600] from Dave Lynn (BNL Atlas), plus third-party analysis software [ IRcamera Thermography Suite].
top
Emissivity
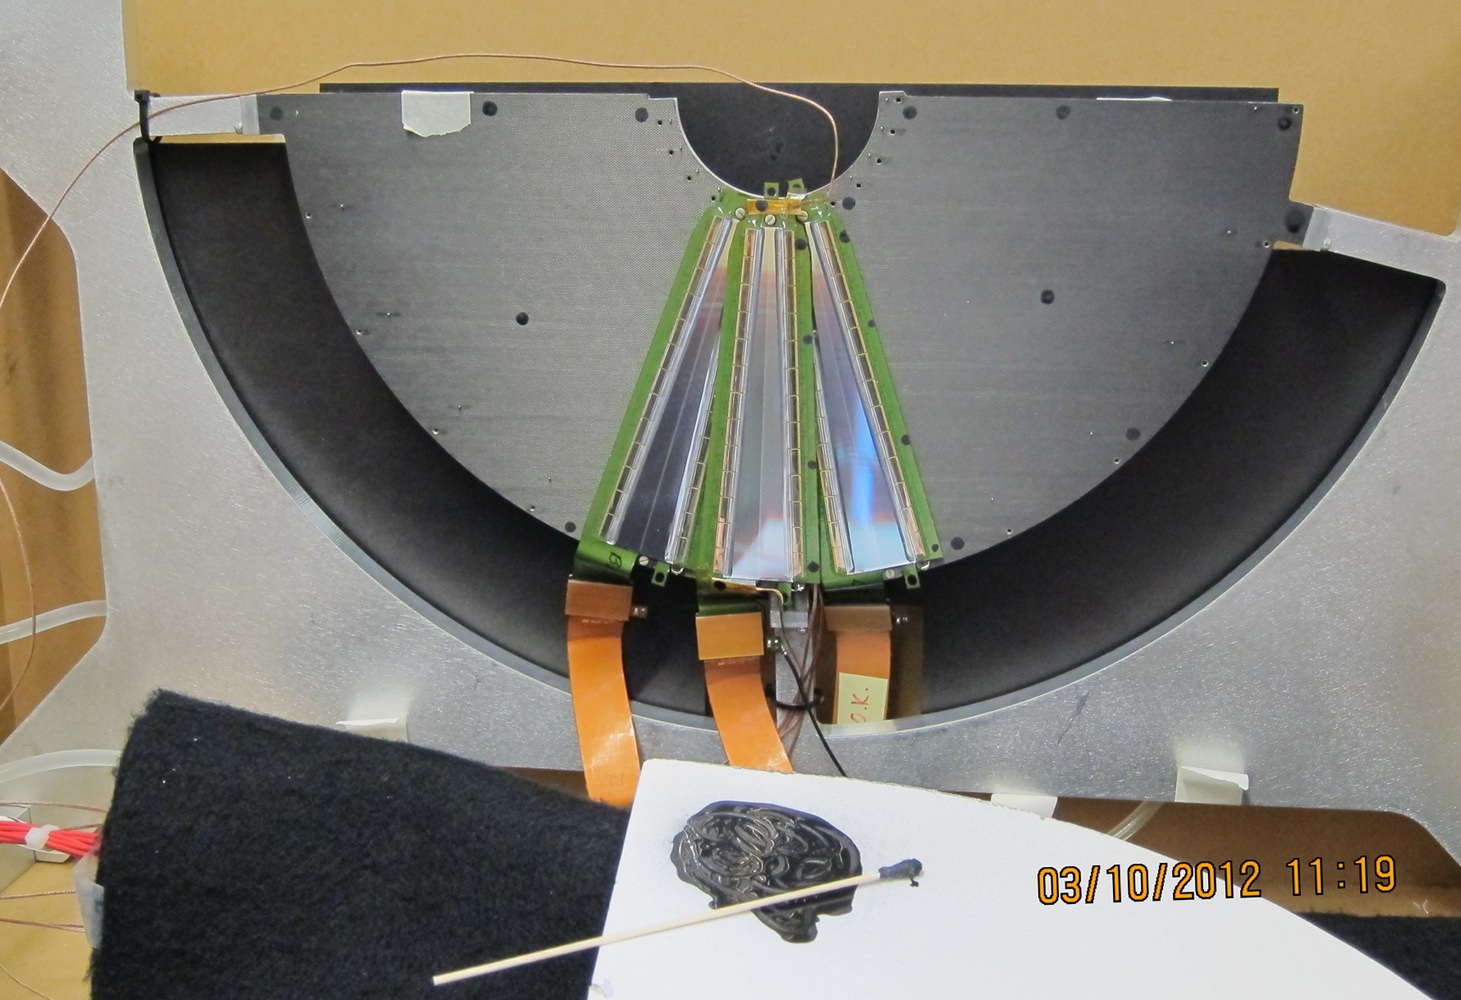
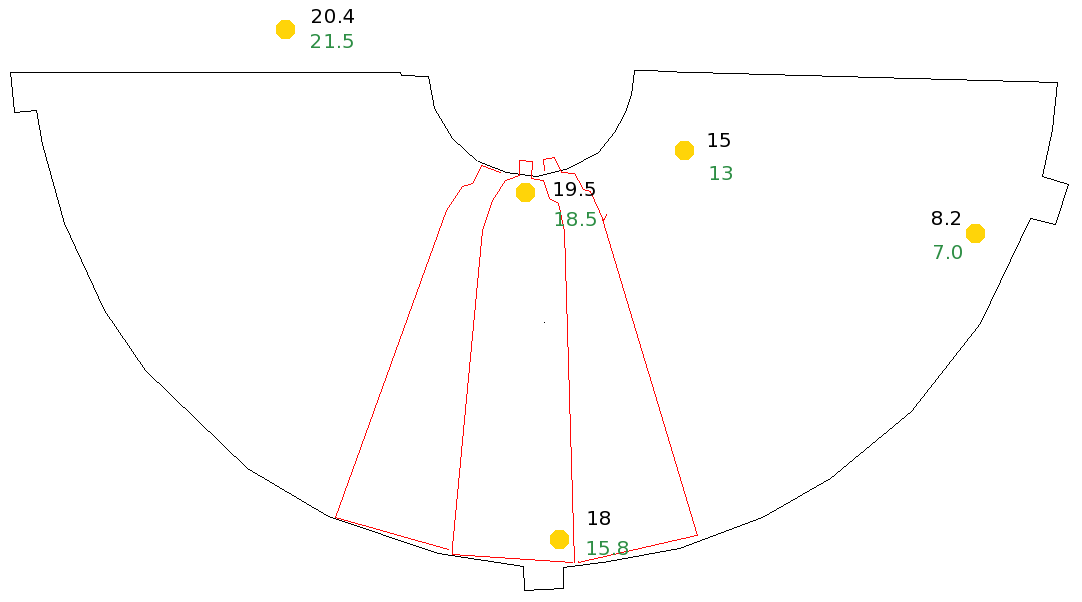
I put black dots of paint in various places. The apparent temperature registered by the camera depends on the emissivity and reflectivity of the material. The dots allow accurate cross-reference between different materials. Dots are also placed on the two thermocouples that are visible.
top
top
Calibration
Checking the thermal images with the IR temperature gun shows small differences, but in general good correspondence. The camera works in the L-band, and the IR gun likely not.
top
Thermocouples
There are 6 thermocouples
top
Power
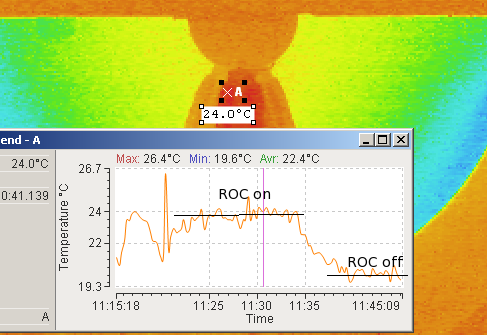
Initially, I ran with only wedge power on, no ROC power. This image shows that ROC power needs to be on - it provides the clock signals to the readout chips, which makes them run. The graph is the temperature of the inside tip of the HDI, with wedge power on, and the ROC power turned off at 11:35, dropping the temperature by 4°.
top
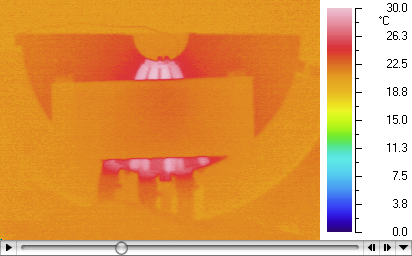
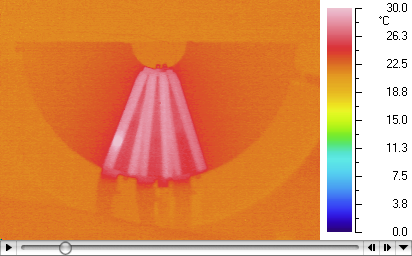
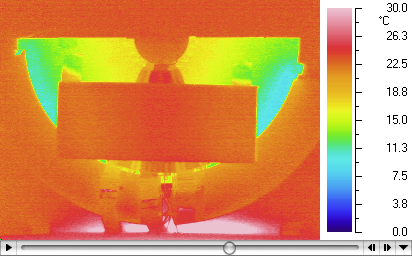
Three wedges, at equilibrium
Image from AVI: 10 mar 13:40. One frame per 2 seconds.
This shows the test disk in the final frame of the movie,
with 3 wedges
powered (4.5V, 1.6A, but note that some of that power gets dumped by the
voltage regulators on the ROC board),
and the cooling running (setpoint 32°F), fluid running from right to left.
Everything has come to equilibrium.
You can see one hot chip on the left wedge.
The input cooling fluid temperature cycles slowly with a 2°C amplitude.
Swings at other points are much smaller.
top
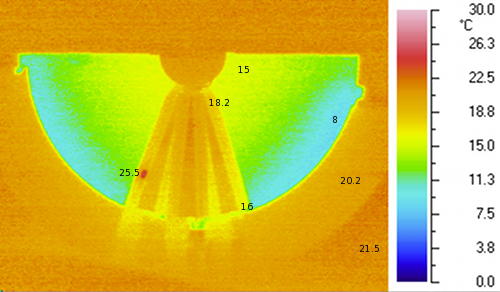
- The thermal gradient along the HDI from the inside to outside radius is not large.
- My feeling is that the temperature on the inside is kept low by radiative transfer to the 15C disk.
|
Single wedge powered, with foam cover (4.5V, 0.48A) full sequence 20x speed avi The setup starts at a uniform temperature, and the wedge power is turned on. | 
|
| After 5 minutes, the wedge temperature reaches 26C. What you see is the HDI on either side of the silicon. The question is, will the wedge heat up more under the foam? Now the cooling is turned on (setpoint 0C). | 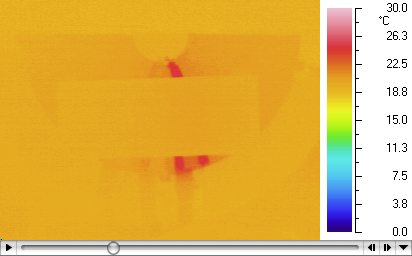
|
| New equilibrium reached after about 5 minutes of cooling. | 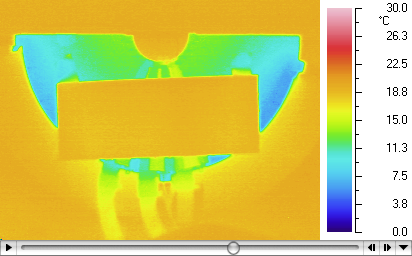
|
| Frame immediately after removal of the foam - nothing spcial went on under the foam. | 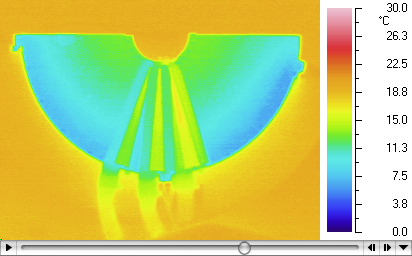
|
| Frame after everything has almost come back to room temperature.
top | 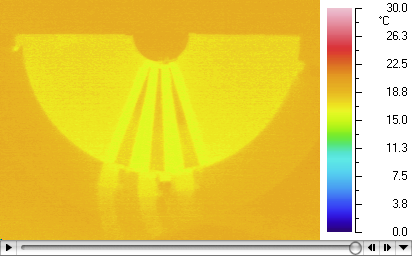
|
|
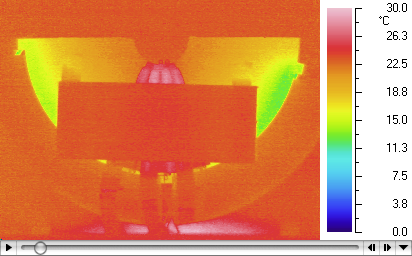
Three wedges powered, with cover 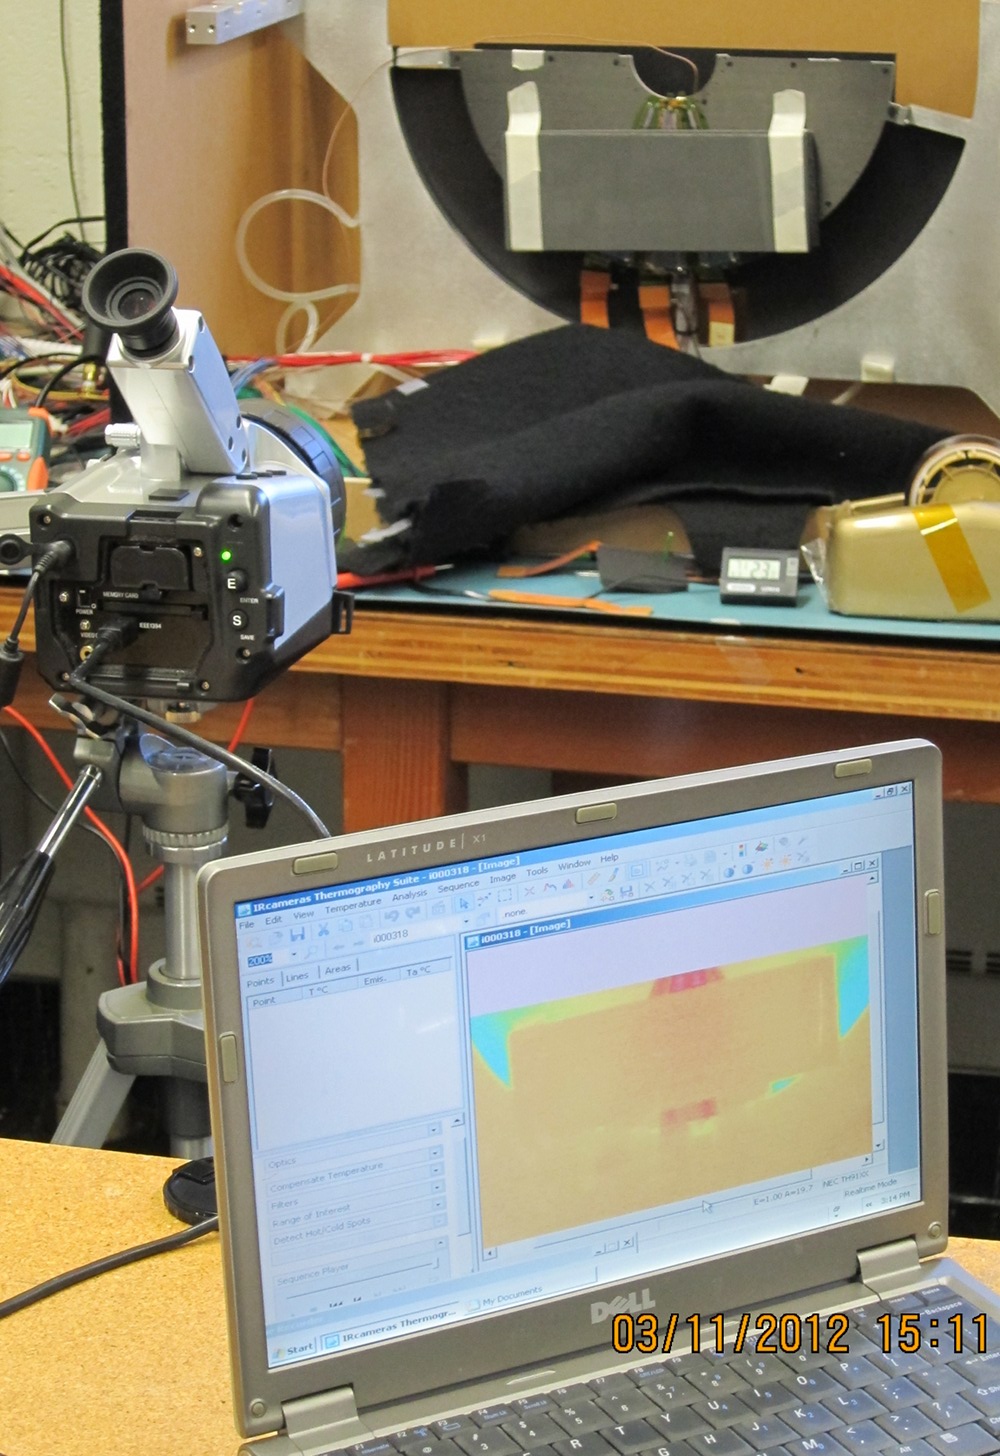
Here is the AVI, on the right are 5 frames. First fame: Start in thermal equilibrium, turn wedge power on, (4.5V 1.6A) Second frame: Wedges reached approximate equilibrium, at ~30C. Turn cooling on, setpoint 0C. | 
|
| |
| Equilibrium with cooling on. Remove the foam. | 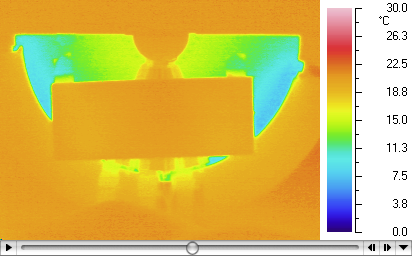
|
| Immediately after the removal of the foam. No great influence on the wedges is ssen. | 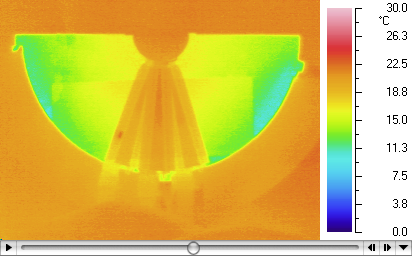
|
| After wedge power and cooling is turned off, everything
goes back to room temperature.
top | 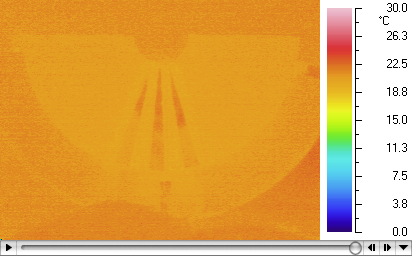
|
|
Three wedges powered, no cover 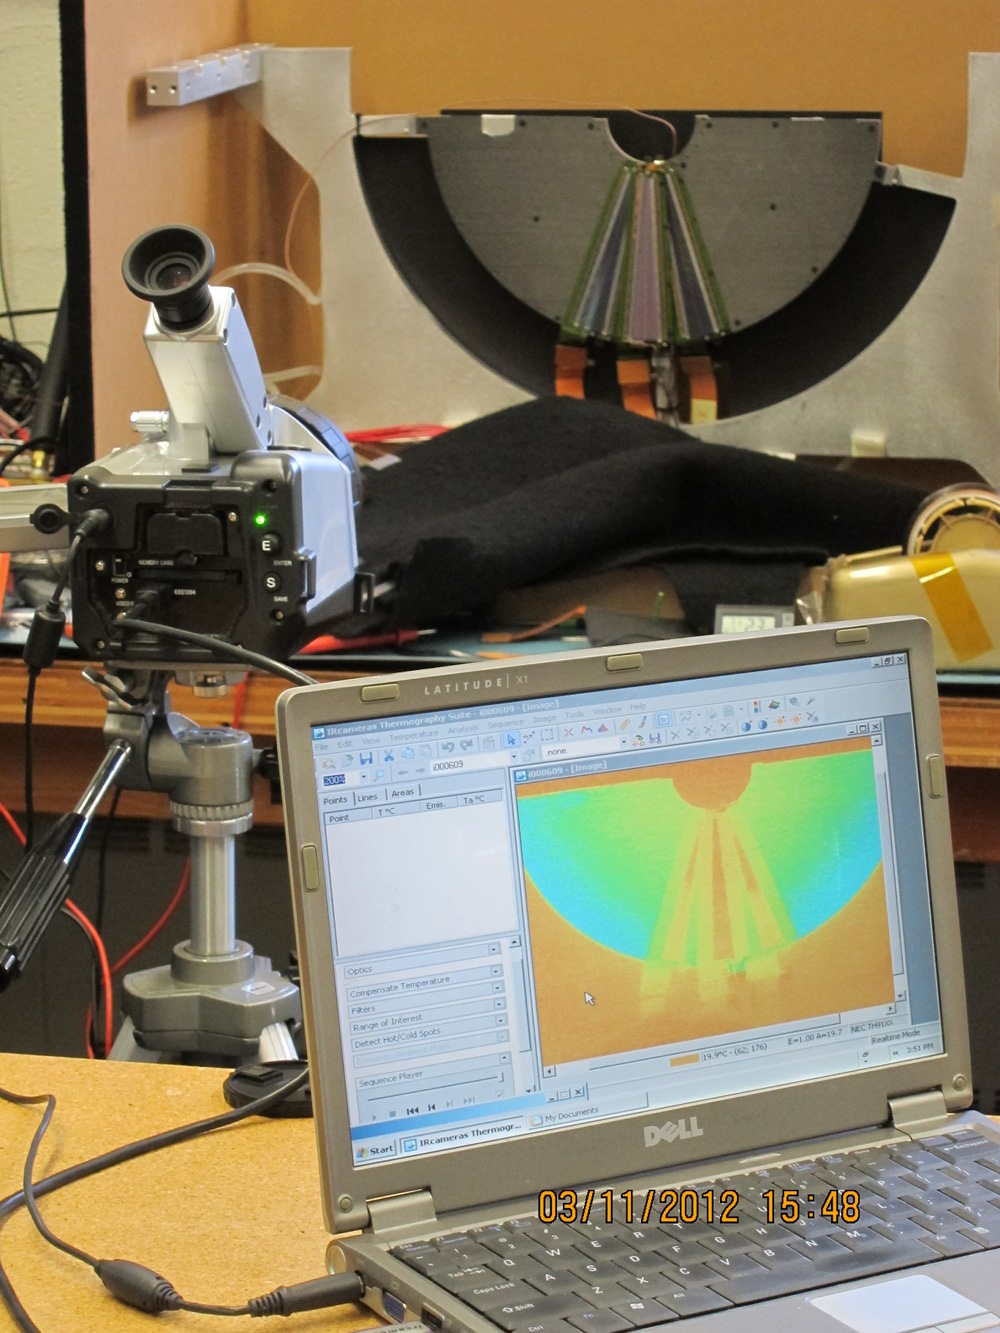
Run 10mar12-1608: 3 wedges, no cover. AVI Originally 970 frames at 2s/frame, then average each 20 frames. Start with everything at room temperature. Next frame, wedges are at equilibrium high temp, and are heating the disk. Now turn on the cooling | 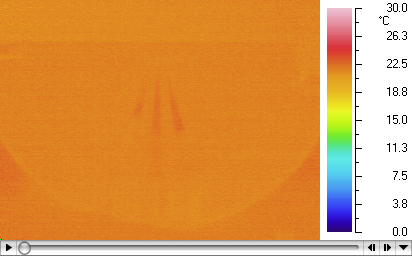
|
| |
| Cooling is coming on | 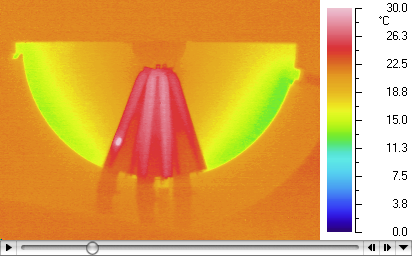
|
| Equilibrium reached between cooling and powered wedges. Now turn off the wedge power | 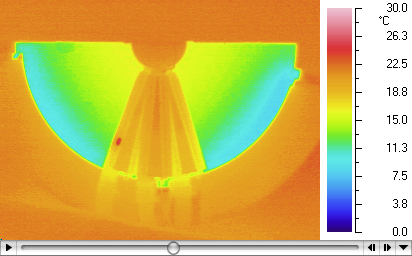
|
| Wedges have cooled off, now turn off the cooling | 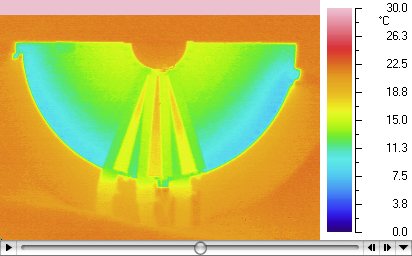
|
| Everything off, relaxed to room temperature.
top | 
|
|
AVI movie, 20x speed (test_12mar12_11513.avi) First frame: power and cooling coming on. Second frame: equilibrium reached.
| 
|
| |
| Immediately after the foam cover was removed. No effect. Note that with the ROC power on, the hot chip does not show up. | 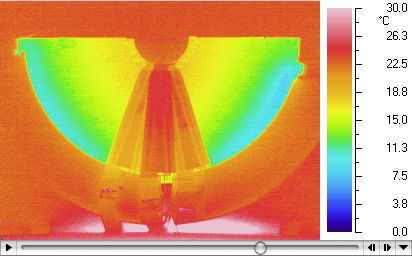
|
| Power off, cooling off. Note you can see the reflected heat
from the ROC on the metal frame.
top | 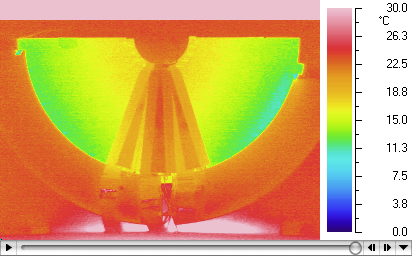
|
|
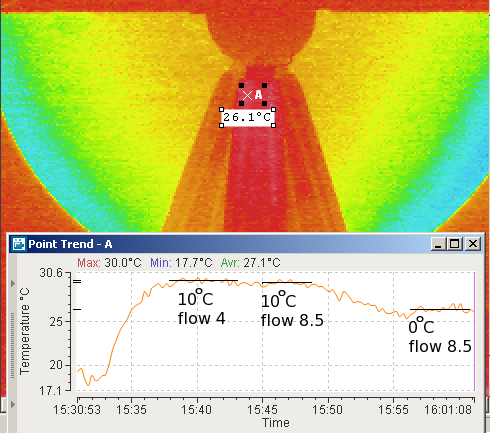
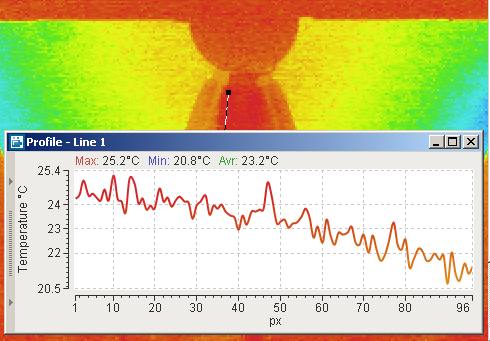
Lower cooling flow AVI movie (test_12mar12_1732.avi) What would be the result of restricting the cooling fluid flow? Currently we get 30 gal/hor/quadrant, which is 7.9 ml/s per half-disk, assuming equal partition of flow. (The design flow was 19 ml/s). The test setup shows flow of 8.5 (units?). The graph shows the temperature near the hottest part of the wedge. The graph starts with the cooling flow restricted to 4.0, and the 3 wedges (and ROCs) just turned on. The temperature saturates at 27.2°C. At frame 264 the flow is turned back up to 8.5, and the temperature settles down at 25°C. | 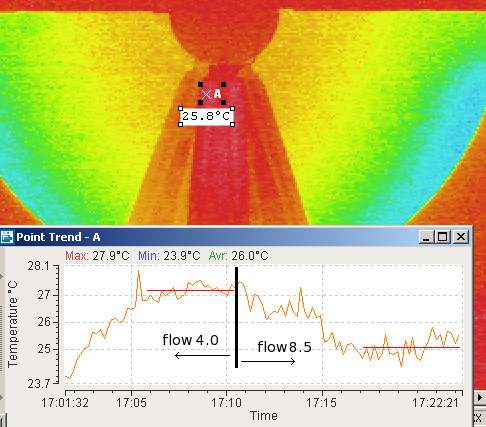
|
| This shows the temperature gradient along the wedge, when the flow is at 4.0. | 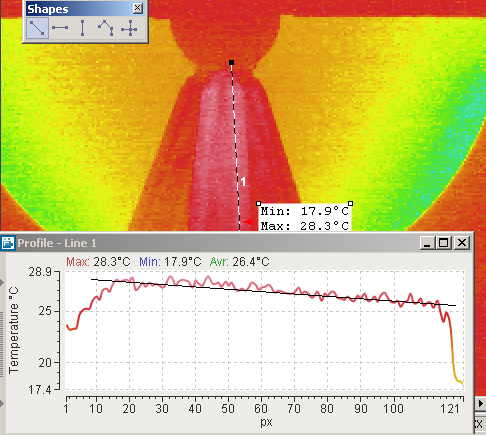
|
| This is the temperature gradient along the wedge when the flow is 8.0.
top | 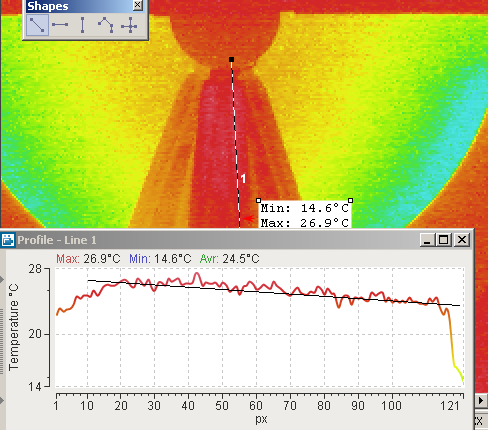
|
One wedge, with ROC, and cover
AVI movie (12mar12_1659) 10x
top
Higher cooling fluid temperature
AVI movie (13mar12_1608) 10x speed
In this run the cooling flow was reduced to 4, and the cooling liquid setpoint was at 10°C. Then the flow was increased to 8.5, and finally the setpoint was loweed to 0°C. Clearly hardly any cooling takes place when the fluid temperature is too close to ambient.
top